Here's how you can check on the Texas grid in real-time

With winter temperatures and last year's freeze still top of mind for many Texans, the Electric Reliability Council of Texas, or ERCOT, has rolled out new dashboards to help you keep tabs on the energy supply in real-time.
You may not have heard of ERCOT until the winter storm in Feb. 2021 that would go on to take the lives of 246 people after the freeze overwhelmed the power grid and left millions freezing in the dark.
According to reporting from our partners at the Texas Tribune, close to two-thirds of the deaths were due to hypothermia.
Since that storm, anxiety has been high. But these dashboards may help Texans get a gauge on what we're dealing with at any given moment.
You can find nine different dashboards on the Grid and Market Conditions page on the ERCOT website.
Each dashboard has a timestamp of when it was last updated and if you select "Full View," you'll get a detailed explanation of what the graphs mean.
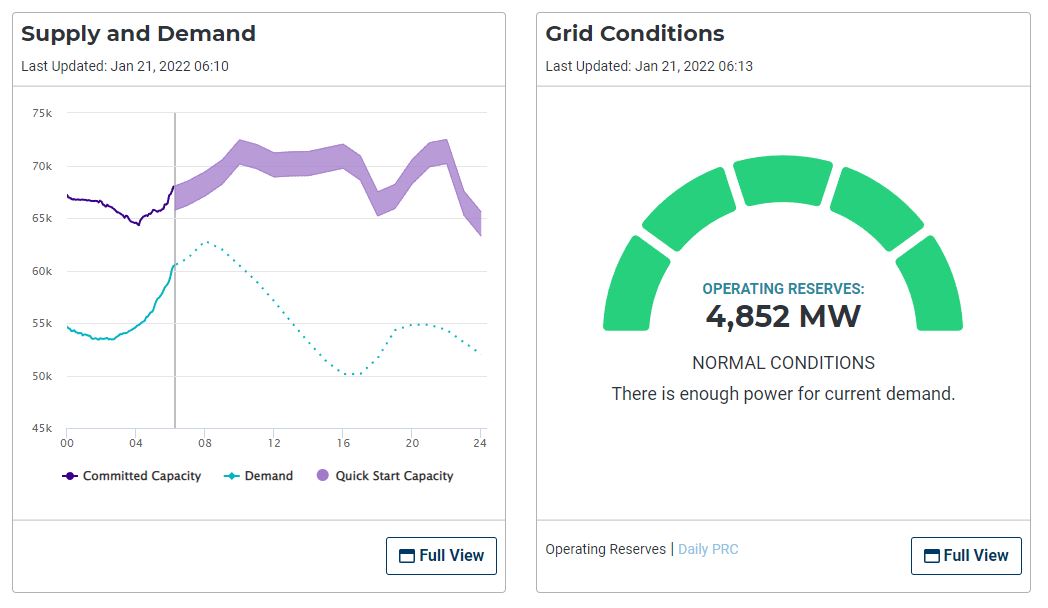
For example, the supply and demand dashboard shows you current power supply and demand as well as projected capacity.
You can also view a grid conditions meter that shows you the current state of grid conditions and our operating reserves.
If things are normal, the grid will be green. But if it's black, that means we're in an energy emergency level 3, so expect controlled outages. Energy conservation would also be critical.
Other dashboards include a real-time look at the system-wide demand, combined wind and solar production, system-wide prices and real-time locational prices.


